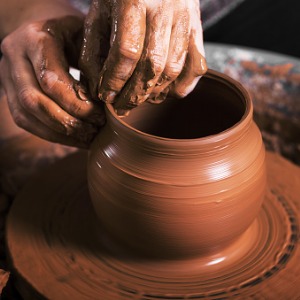
There are currently an estimated 43,000 potters in the United States. The potter job market is expected to shrink by -2.6% between 2016 and 2026.
How employable are potters?
CareerExplorer rates potters with a F employability rating, meaning this career should provide poor employment opportunities for the foreseeable future. Over the next 10 years, it is expected the US will need 5,100 potters. That number is based on the retirement of 6,200 existing potters.
Are potters in demand?
Aspiring potters will continue to face employment challenges. Historically, these artisans, who are often self-employed, have had to supplement their income with work in other fields or by assuming related part-time functions, such as teaching ceramics. This trend is likely to persist. Exerting further financial pressure on the potter community is the fact that many in the field are paid on a commission basis for crafting items for businesses or individuals. This means that it is not uncommon for potters to face fluctuating and uncertain incomes, as only the most successful among them receive major commissions for their work. In addition, gaining exposure in galleries, which is one of the keys to distinction and stature, is highly competitive, even rare. A limited number of opportunities occurs in the clay product and refractory manufacturing industry, which produces large numbers of specific items. On the other hand, this mass production could negatively impact the marketability of independent potters. Regardless of whether they are working on their own or as an employee, potters’ livelihoods are impacted by economic conditions, as art of all kinds is generally purchased more frequently when consumers can afford to spend more money on nonessentials. Demand from private collectors may be less susceptible to downturns in the economy; but private collections account for a very small portion of the potter marketplace. Experienced potters looking to advance in this career typically seek opportunities in community arts work; gallery and arts management; or with art schools.
What’s the supply of potters?
The potter industry is concentrated in California, Texas, Pennsylvania
Potter job market by state
| State Name | Employed Potters |
|---|---|
| California | 4,930 |
| Texas | 3,110 |
| Pennsylvania | 2,760 |
| Ohio | 2,690 |
| Florida | 2,280 |
| Wisconsin | 1,490 |
| Illinois | 1,490 |
| Indiana | 1,340 |
| Massachusetts | 1,160 |
| Missouri | 1,130 |
| New York | 1,060 |
| Tennessee | 1,050 |
| Oklahoma | 1,040 |
| Georgia | 1,020 |
| Virginia | 960 |
| North Carolina | 890 |
| New Jersey | 890 |
| Utah | 850 |
| Minnesota | 830 |
| South Carolina | 830 |
| Washington | 740 |
| Iowa | 740 |
| Kansas | 680 |
| Kentucky | 520 |
| Arizona | 400 |
| Colorado | 360 |
| Arkansas | 360 |
| Mississippi | 330 |
| Nevada | 330 |
| Oregon | 310 |
| New Hampshire | 270 |
| West Virginia | 260 |
| Maryland | 250 |
| Alabama | 210 |
| Connecticut | 180 |
| Maine | 160 |
| Montana | 150 |
| Nebraska | 150 |
| Vermont | 130 |
| Louisiana | 120 |
| Delaware | 110 |
| North Dakota | 60 |
| Rhode Island | 60 |
| South Dakota | 50 |
| New Mexico | 50 |
| Idaho | 50 |